Introduction
With the 2024 presidential election starting to take shape, America’s spiral toward further polarization and tribalism seems poised to continue. Economic challenges are front and center in people’s minds, including a spending and debt crisis, inflation, banking uncertainty, and the possibility of a coming recession. Adding to those challenges are concerns about the rise of artificial intelligence, Russia’s war in Ukraine, and the growing influence of China.
In times like these, it is especially relevant to identify common narratives that provide unity and hope amidst the plethora of challenges we face. For centuries in the United States, that narrative was found in the national ethos of the American Dream, which brought people together through a positive, future-oriented mindset that led individuals, families, and the broader society to flourish. Today, many proclaim the American Dream is dead—but is it? First, we must define the American Dream.
One of the most important and lasting definitions for the American Dream comes from James Truslow Adams in his 1931 book The Epic of America:
. . . that dream of a land in which life should be better and richer and fuller for every man, with opportunity for each according to his ability or achievement. It is not a dream of motor cars and high wages merely, but a dream of a social order in which each man and each woman shall be able to attain to the fullest stature of which they are innately capable, and be recognized by others for what they are, regardless of the fortuitous circumstances of birth or position.
This definition informs much of what our national conversations revolve around today—that the American Dream is more than just a caricature of material wealth. The American Dream is an aspirational ideal that provides hope. It is about the journey more than the destination. And the attitudes and narratives surrounding it can serve a bigger role in animating our national identity, uniting us against shared challenges, and inspiring future generations.
In the fourth edition of our study on attitudes about the American Dream and economic opportunity, we continue to see a strong belief in the promise of the American Dream. However, compared to last year, the number of Americans who believe the American Dream is out of reach is on the rise. This trend of increased pessimism showed up for all respondents regardless of age, income, education, and ethnicity.
For this survey, we partnered with NORC at the University of Chicago and its AmeriSpeak® panel. AmeriSpeak® is a probability-based panel designed to represent the US household population. Randomly selected US households are sampled using area probability and address-based sampling, with a known, nonzero probability of selection from the NORC National Sample Frame. The nationally representative sample consisted of 2,187 respondents. The survey was conducted May 11-15, 2023.
Key Findings
- As in previous years, most Americans, regardless of age, race/ethnicity, income, or education, believe they have either achieved the American Dream (33 percent) or are on their way to achieving it (42 percent).
- The percentage of people who said the American Dream is out of reach rose to 24 percent, up from 18 percent in 2022. This number had steadily declined over the past two years, before returning to the previous high (24 percent) reported in 2020.
- Most Americans regard living better and fuller lives, rather than simply becoming wealthy, as essential to achieving the American Dream. When asked what factors are essential to achieving the American Dream, freedom of choice in how to live and having a good family life ranked at the top. Respondents ranked “becoming wealthy” as the least essential consideration. This has been a consistent finding since we started the survey in 2020.
- Most Americans believe they have the same (32 percent) or more (48 percent) opportunities than their parents. Similarly, most Americans say their children will have the same (27 percent) or more (33 percent) opportunities than they had.
- Consistent with other results, more respondents expressed pessimism about intergenerational opportunity this year than in the past, including 19 percent of respondents who believe they have fewer opportunities than their parents and 18 percent of respondents saying their children are likely to have fewer opportunities than they had.
The American Dream Is Alive and Well
Economists define the American Dream as social or income mobility, which in technical terms measures whether an individual out-earns their parents around the same age, usually between 32 and 40 years old depending on the study. Based on this definition, the latest research produced by the Archbridge Institute, in collaboration with Scott Winship, shows that about seven in 10 people out-earn their parents as adults. This figure is higher than the income mobility metrics reported by Raj Chetty and his team at Opportunity Insights, which finds that only about five in 10 Americans will out-earn their parents. However, after adjusting the Opportunity Insights figures for changing trends in family structure, the number gets closer to seven in 10 Americans.
Of course, income mobility offers only one, narrow measure of the American Dream. Although social mobility is certainly part of Adams’ definition, it is by no means limited to a material endeavor. As the responses to our survey show, the American Dream is much more than that; it is an aspirational, psychological, and attitudinal narrative. Therefore, it is also helpful to ask people directly about their own American Dream and how close they are to achieving it.
That is the focus of our first question. In Table 1, we can see that most people (76 percent) said they have either already achieved the American Dream or are on their way to achieving it. Only one in four people said they think the American Dream is out of reach. However, that figure grew from 18 percent in 2022 to 24 percent this year.

Comparing this year’s results to past surveys, we find a consistent majority saying they have either achieved the American Dream or are on their way to achieving it. However, the number of people who believe the American Dream is out of reach is on the rise for the first time since we started this survey in 2020. The possible factors contributing to this more negative outlook are numerous, including high inflation, fears of an economic recession, housing shortages, higher crime rates, decreased labor force participation, political polarization, fewer community bonds, increased loneliness and mental illness, and many others. Identifying the causes of this pessimism will require further analysis beyond the results of this survey. Nonetheless, it continues to be the case that the majority of people believe in the promise of the American Dream.

When it comes to specific demographic trends, the majority of Americans across age groups, education, ethnicity, and income agree that they have either already achieved the American Dream or are on their way to achieving it. However, a few results stand out.
Related to age, older Americans are more likely than younger Americans to report positive results for achieving the American Dream. This does not come as a surprise, as older Americans have had more time to pursue and achieve success; in time, younger generations may come to reflect similar perceptions. Interestingly, one of the largest jumps in pessimism was observed among Americans ages 45-59; in 2022, 15 percent said the American Dream was out of reach, which increased to 27 percent in 2023.
When it comes to education, those with less educational attainment are more likely to say the American Dream is out of reach. In fact, the percentage of Americans with only a high school diploma who believe the American Dream is out of reach is nearly double that of those with a bachelor’s degree or more. Moreover, this trend is on the rise; in 2022, 15 percent of people without a high school diploma said the American Dream was out of reach, which increased to 31 percent in 2023.
Related to race and ethnicity, fewer whites report that the American Dream is out of reach compared to Blacks, Hispanics, and other groups like Asian Americans. The biggest difference compared to last year comes from Hispanics (increased from 16 percent to 28 percent) and Asian Americans (increased from 17 percent to 29 percent).
As we will see in the next questions, even though becoming wealthy is not generally viewed as essential for achieving the American Dream, those with lower incomes are more pessimistic about the American Dream and more likely to say it is out of reach.

The American Dream Is About More than Just Economic Wealth
What do our current narratives and public debates tell us about the American Dream? There is an overtly material focus on owning a house or a car, becoming wealthy, and being able to afford a wider array of material goods. However, as in previous years, we asked people to rate a holistic set of factors related to the American Dream. Respondents were asked to say whether they viewed each factor as “essential,” “important but not essential,” or “not important” to their own view of the American Dream.
Consistent with past surveys, the two most popular responses ranked as essential to the American Dream are “freedom of choice in how to live” and “a good family life.” Roughly eight in 10 Americans share these values, with the rest mostly viewing these items as important but not essential; only two percent of people think these factors are not important for achieving the American Dream. These results speak more to the “better” and “fuller” aspects of James Truslow Adams’ definition. Other factors that rank highly as either essential or important include having a good retirement, owning a house, and having a successful career.
We can look closely at one milestone often linked with the American Dream: owning a home. In 2023, only 50 percent of Americans believe owning a home is essential to their view of the American Dream, 40 percent say it is important but not essential, and seven percent say it is not important. Moreover, only one in 10 Americans believe becoming wealthy is essential to achieving the American Dream, while more than 30 percent think it’s not important.
Having a fuller life continues to be the most common theme when discussing the American Dream. The national ethos of the American Dream is more holistic and encompassing than we might think. And in that diversity of subjective views of what could represent “fuller lives,” like freedom of choice in how to live and having good family lives—whatever that might mean to people—lies a strength of the American experience that can unify us as a nation.

Table 5 shows the comparisons during the last four years on what people consider as essential to the American Dream. The larger trends and responses remain consistent throughout the years.


What we can see is that valuing freedom of choice in how to live and having a good family life is consistent across all ages, education, ethnicity, and income groups. Slight differences can be observed between the views of older and younger generations, especially on the issue of becoming wealthy. Only six percent of Americans ages 60+ say becoming wealthy is essential, which increases among lower cohorts until reaching 23 percent among Americans ages 18-29. This is likely a consequence of the time of life people find themselves in and the attendant priorities. As we continue this survey work, it will be interesting to see whether these effects follow each cohort or are mitigated with age. Additionally, we can see some marked differences across ethnic groups, while education and income groups show little variation.
Do We Have More Opportunities?
When discussing the United States and the American Dream, the phrase “land of opportunity” often comes up. More abundant opportunities create more paths to flourishing as people pursue better, richer, and fuller lives for themselves and their families. Abundance of opportunity—experienced through a vibrant market economy, high levels of economic freedom, and celebration of the entrepreneurial spirit—continues to be one of the bedrock foundations of what entices people to come to the United States.
As our previous surveys have shown, most people believe they have more opportunities to succeed than their parents. As Table 7 shows, five in 10 Americans said they have more opportunities than their parents, three in 10 Americans said they have about the same opportunities, and two in 10 Americans said they have fewer opportunities. Although these results are positive, Table 8 shows a shift over the past year toward fewer people believing they have more opportunities than their parents.


Delving deeper into the changes, Table 9 breaks down the demographic responses to this question. Notably, much of this changing trend is being driven by younger age groups. Although all age groups are more pessimistic than in the past, respondents ages 18-29 have seen the biggest change since 2022. Last year, only 14 percent of people in that age group said they had fewer opportunities than their parents, compared to 25 percent in 2023. For respondents ages 30-44, pessimism rose from 18 percent in 2022 to 23 percent this year, and for respondents ages 45-59, it rose from 13 percent to 20 percent.
There is also a marked difference in terms of people with a lower level of educational attainment. Groups with a high school diploma or less showed significant jumps in the number of people reporting they have fewer opportunities than their parents. For those without a high school diploma, 17 percent said they have fewer opportunities in 2023, compared to only six percent in 2022. For people with a high school diploma or equivalent, the number rose from 13 percent last year to 21 percent in 2023.
Related to race and ethnicity, the biggest difference this year was in the category for other ethnicities, which mostly encompasses Asian Americans. In 2022, six percent of respondents in this group said they had fewer opportunities than their parents, which increased to 21 percent this year.
Despite this more negative outlook, it is worth reiterating that the majority of people in all demographic groups (except those without a high school diploma) continue to believe they have more opportunities than their parents, and 30 percent believe they have about the same opportunities. People who believe they have fewer opportunities are still a minority of respondents.

Building on these themes, how do people believe future generations will fare? Table 10 shows responses to the question, “Relative to your own opportunities for success, how do you view opportunities for your children?” According to the results, most people believe their kids will have more opportunities than they did (33 percent), while 27 percent believe their kids are likely to have about the same opportunities, and 18 percent think their kids are likely to have fewer opportunities. Of those surveyed, 22 percent reported having no children.


What Is the American Dream?
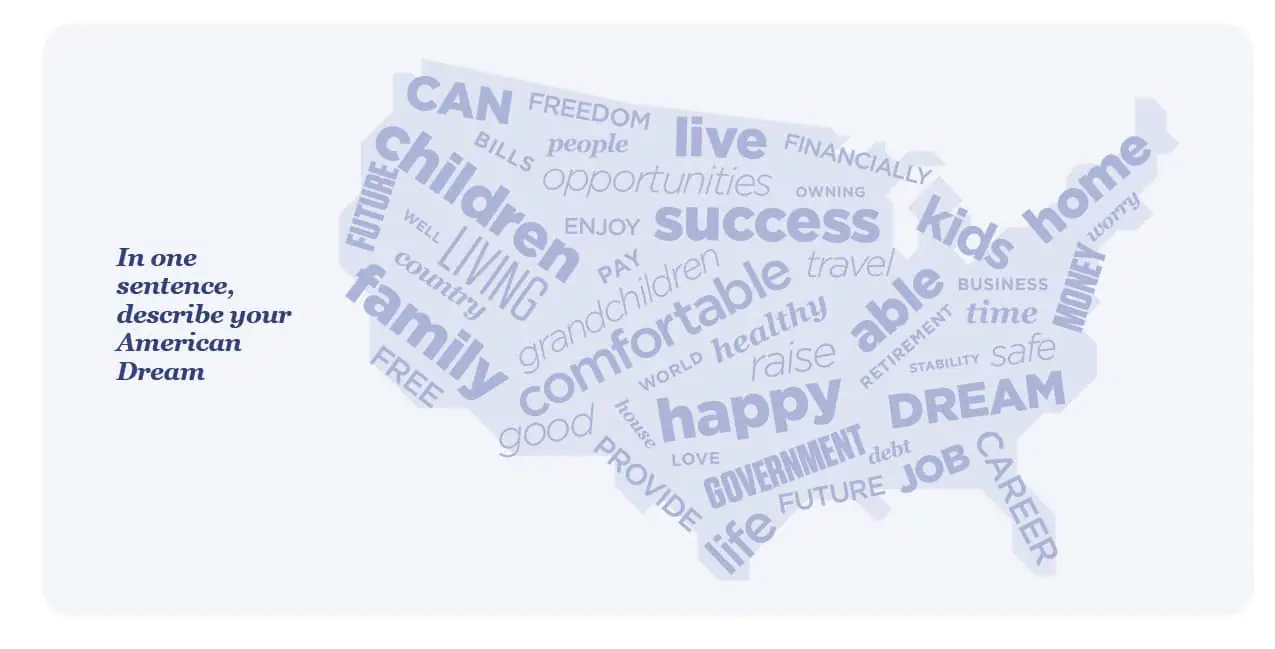
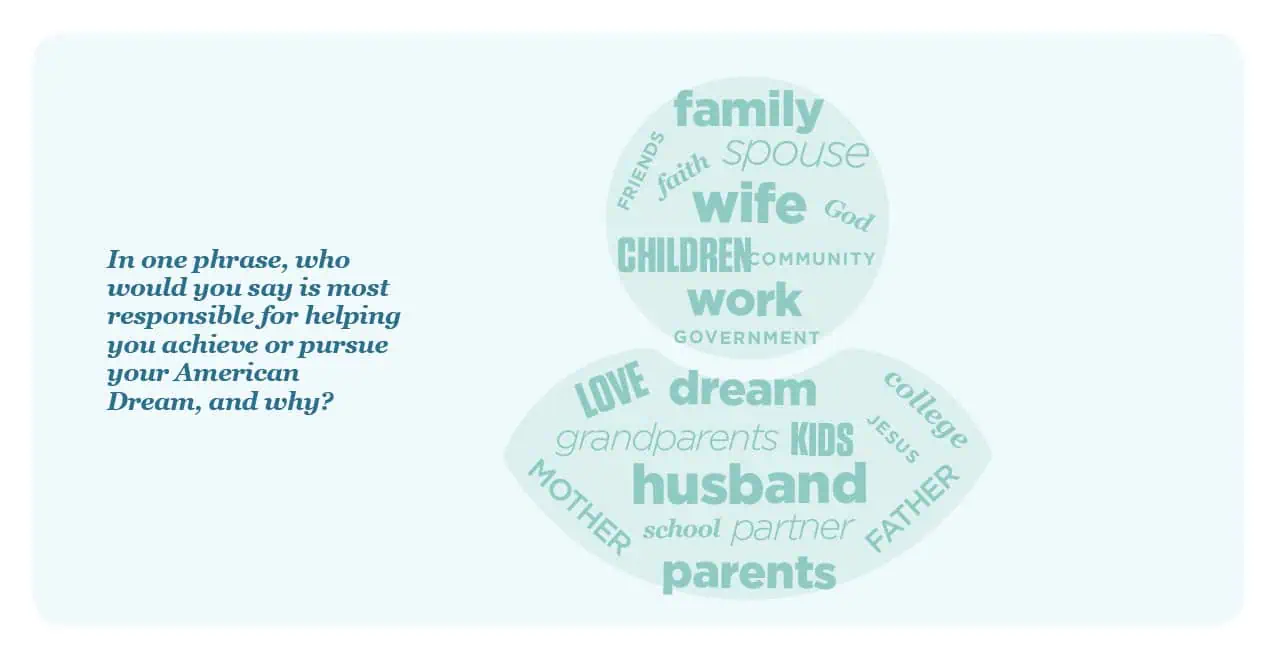
Besides outlining some possible factors that could be essential components of the American Dream, we wanted to know how people think about their own American Dream. Therefore, we asked Americans to answer open-ended questions describing their American Dream and the people who have or are helping them achieve it. These responses will be published in a forthcoming Archbridge Institute report with a more detailed analysis. However, we include here a word map showcasing some common themes. When asked to describe their American Dream, the most repeated words included “happy,” “family,” “life,” “children,” “comfortably,” and “home.” When asked about the people who are helping them achieve the American Dream, the most common responses included “parents,” “family,” “husband,” and “work.” These ideas help us visualize the power and inspiration of the American Dream, as well as the narratives we all share.
In one sentence, describe your American Dream.

In one phrase, who would you say is most responsible for helping you achieve or pursue your American Dream, and why?

Conclusions
We set out to measure the health and state of the American Dream, and while the results continue to show large agreement and optimism across Americans of diverse age, race/ethnicity, education, and income groups, there are signs of declining belief in the United States as the “land of opportunity.”
As we face economic challenges, social difficulties, and a presidential primary race, the national ethos of the American Dream can unify us in our diversity. The American Dream is about living better, richer, and fuller lives, and the majority of Americans continue to believe in the hope and promise of that vision. This can serve our nation to build bridges, find common narratives, and tackle big challenges on a solid foundation of freedom, responsibility, and dynamism.
Previous Snapshots
Gonzalo Schwarz is the President and CEO of the Archbridge Institute. Follow his work @gonzaloschwarz and subscribe to his newsletter, Living the Dream.


